

In this article
Twenty-one goals conceded is a failure of defending. It is not, by itself, a recruitment report on the centre-backs. Fiorentina are losing the final duel too often. They are also losing the earlier battle over where that duel takes place and how much protection the defender has when it arrives.
Nine league games, eleven goals scored, twenty-one conceded, no clean sheet. Only Monza and Sassuolo have conceded more, with twenty-two each. This is no longer the bill for one disastrous evening. The pattern demands a coaching response.
We attack enough to ask a harder question
The suggestion that Fiorentina defend so much because they barely attack does not survive the first check. We average 16.6 shots per game; opponents average 14.3. Look at shots on target, however, and the balance reverses: 4.9 against 6.1. Opponents shoot less often and make the goalkeeper work more often.
Plenty of shots, insufficient control
That is roughly 30 per cent of our attempts on target against 43 per cent of theirs. Accuracy is not the same as chance quality. Still, a lead in total shots is poor consolation when the other side more regularly reaches the goalkeeper. Possession near the opposition box does not automatically amount to control.
I would start with the players behind an attack. If both full-backs advance and a midfielder joins the box, who is ready when the pass fails? A centre-back cannot press the receiver, watch the striker and track the runner from midfield at once. Pace helps. A properly positioned teammate helps more.
Atalanta exposed the distance between pressure and control
FotMob recorded 26 shots to ten in the 2–2 draw on 29 October. Expected goals were much closer, at 1.51 to 1.01. Opposition-box touches, 39 to 31, hardly describe a game played around one goal alone. The shot count flatters the size of Fiorentina’s attacking advantage.
Njie scored in the 53rd minute and João Mário in the 61st. Zalewski equalised in the 74th. Fiorentina held the lead for thirteen minutes. A struggling team needs to change its risk-taking once it gets ahead: keep playing, but stop treating every possession as an invitation to rush another attack.
The match record cannot establish who misplaced himself for the equaliser. Assigning the goal to a centre-back or midfielder requires the footage. It does establish why an improved attacking display cannot yet be treated as proof of recovery. Improvement must survive the period when the team has something to protect.
The defenders still have questions to answer
Organisation is no blanket acquittal. The individual figures contain genuine warning signs, and they are not identical across the back line. This is a table of duels rather than a complete ranking of defenders; the cut-off column matters.
| Player | Minutes | Duels won | Win rate | Aerial duels won | Cut-off |
|---|---|---|---|---|---|
| Drăgușin | 720 | 33 | 56,9% | 18 / 27 | 25.10 |
| Viery | 402 | 15 | 39,5% | 3 / 13 | 25.10 |
| Pongračić | 208 | 7 | 43,8% | 2 / 4 | 29.10 |
| Ranieri | 309 | 11 | 57,9% | 5 / 6 | 29.10 |
| Jiménez | 606 | 36 | 60,0% | 4 / 7 | 29.10 |
| Valdepeñas | 441 | 19 | 42,2% | 7 / 11 | 29.10 |
| João Mário | 273 | 16 | 57,1% | — | 29.10 |
| Dodô | 136 | 6 | 66,7% | — | 29.10 |
Before Atalanta, Drăgușin had won 18 of 27 aerial duels. Viery had won three of thirteen. Those are different profiles, with different implications for protecting crosses and second balls. Ranieri’s five wins from six aerial contests look encouraging, but six events cannot establish the answer to a defensive crisis. Nor can Dodô’s percentage across 136 minutes settle the selection debate.
A defender who closes a passing lane may record no tackle. Another may win a difficult duel after helping create the danger in the first place. Duel success starts a useful conversation; it cannot finish it.
The midfield must defend before the ball passes it
The first relationship I would repair is the distance between the holding midfielder and the centre-backs. Once an opponent’s opening pass breaks through the middle, the defence has to retreat towards its own goal. It loses the chance to direct the next phase. One defender steps out, another covers him, and the original structure starts to unravel.
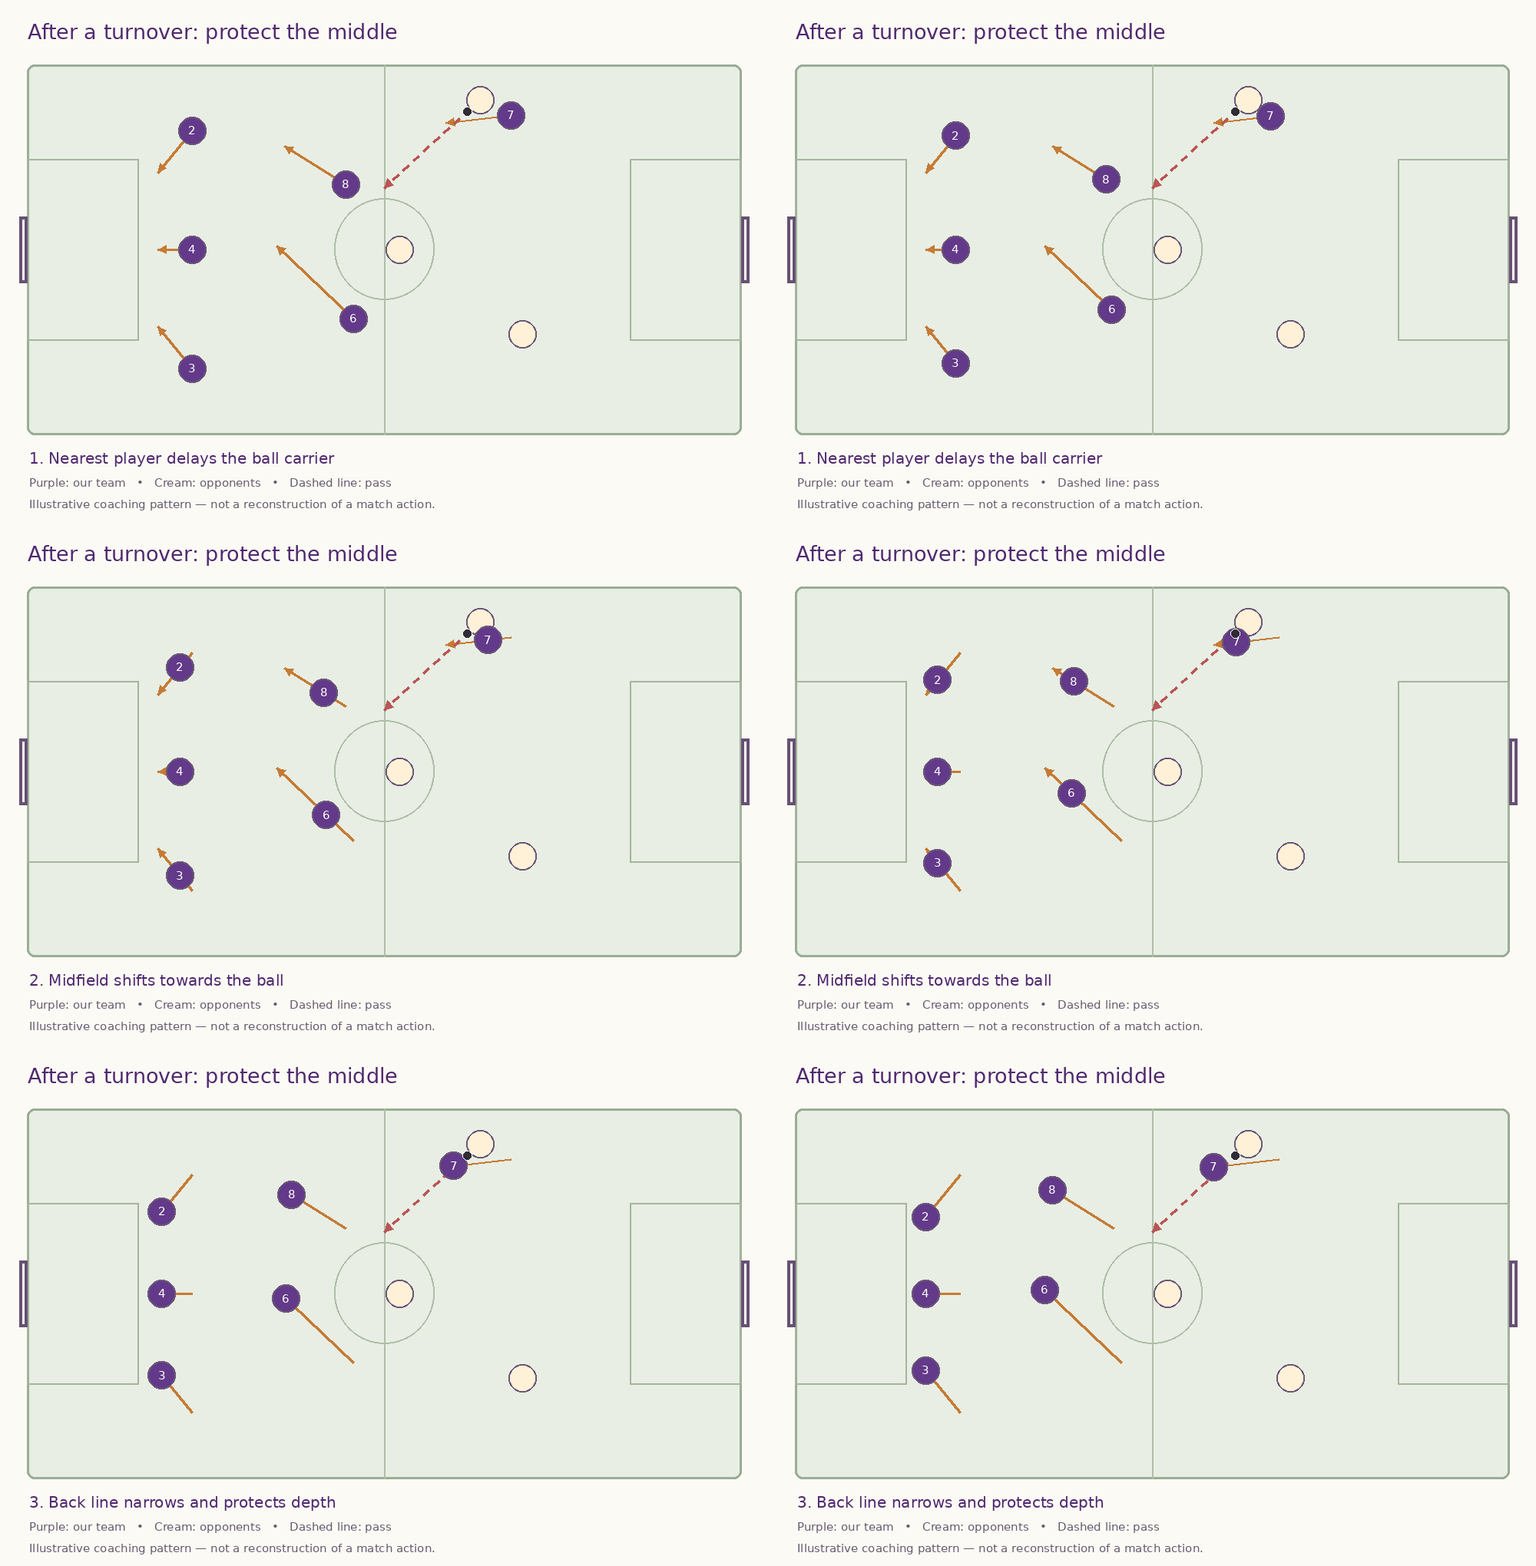
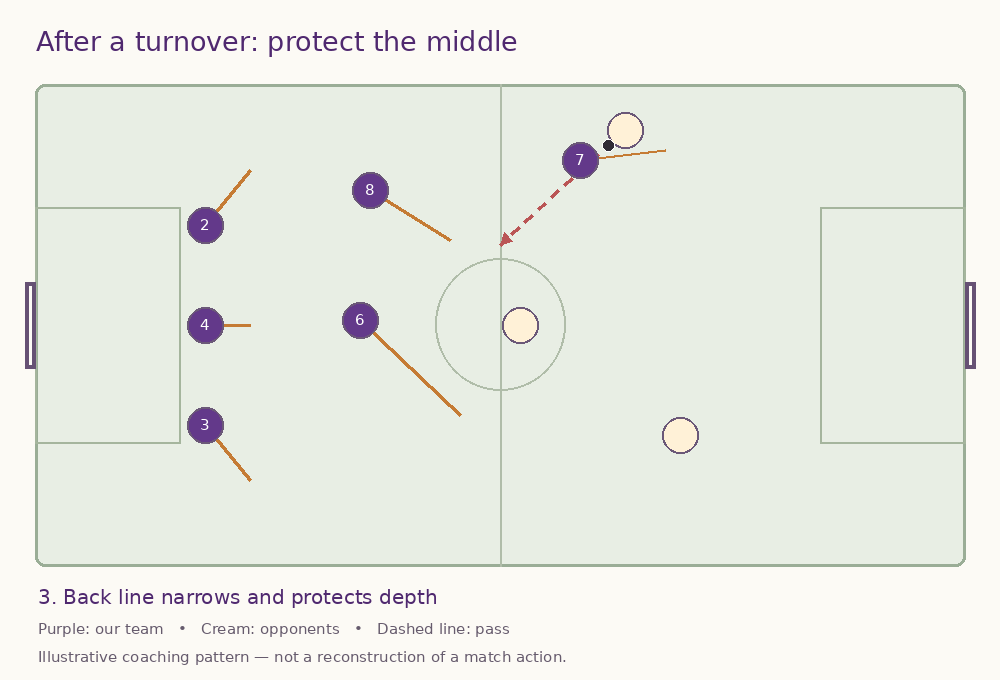
After losing possession, the nearest player should delay the ball carrier. The near-side eight closes the inside pass; the six protects the space ahead of the centre-backs; the far-side full-back narrows. The first action need not win applause. It must prevent the next action becoming desperate.
Protecting your own attack
Attacking choices belong in this discussion too. Keep a short return pass available and someone ready for the clearance. Without that support, a difficult shot can become the opening pass of the opponent’s counterattack. Protecting our goal starts before we shoot at theirs.
Show the animated tactical pattern
De Gea cannot close the whole account
Nine matches have brought 33 saves, a 61.1 per cent save rate and a FotMob goals-prevented figure of −1.83. The latter places his shot-stopping below the model’s expectation. He is not currently lifting the team above the difficulty of the shots reaching him.
StatsNext’s rounded xGA average is about 1.5 per match; actual goals conceded average 2.33. That gap deserves attention. Subtracting a goalkeeper model from a pre-shot xG model and calling the remainder the centre-backs’ fault would not explain it. The practical demand is clearer: better saves, and fewer saves attempted on the opposition’s terms.
What would count as progress
Look beyond the next result. Fewer opposition shots on target, midfielders close enough to protect the centre, calmer decisions after taking the lead: those would indicate greater control. Winning while conceding another two would bring relief. It would not settle the argument.
Fiorentina have defenders who need to defend better. They also have a team that too often lets opponents choose the place and timing of the examination. Until both change, every new centre-back risks looking like the next player who needs replacing.
Team figures cover nine Serie A rounds through Atalanta, 29 October 2026. Sources: Lega Serie A, StatsNext and FotMob. Individual cut-offs appear in the table. Tactical recommendations are editorial assessments of the data, not a full video audit of the goals.